Cloudify Spring Boot Application (Part III)
This blog post is a series of three posts.
- In the first of the posts I described how to Dockerize a Spring Boot application and run it in Kubernetes.
- The second part of the tutorial looks on how to monitor the application and see if everything is ok.
- And in this part of the series I’ll look on how to analyze and collect logs of the Spring Boot application.
The easiest part to export logs is to send them in JSON-Format to stdout. Then a tool called fluentd can scrape the logs and send them to Elasticsearch. Elasticsearch stores the metrics and makes them searchable. Together with Kibana a Dashboard for searching in Elasticsearch we can analyze and search through them.
Configure Spring Boot to send logs in JSON-Format
To configure Spring Boot to send JSON-Format to stdout is very easy. First we add the following dependency to our pom.xml file, this is required to get standard Encoder for JSON output to stdout:
  <dependency>
      <groupId>net.logstash.logback</groupId>
      <artifactId>logstash-logback-encoder</artifactId>
      <version>5.1</version>
  </dependency>
After this we’ll add a logback-spring.xml file to our resources folder, this configures logback for JSON output:
<configuration>
    <appender name="consoleAppender" class="ch.qos.logback.core.ConsoleAppender">
        <encoder class="net.logstash.logback.encoder.LogstashEncoder"/>
    </appender>
    <logger name="jsonLogger" additivity="false" level="DEBUG">
        <appender-ref ref="consoleAppender"/>
    </logger>
    <root level="INFO">
        <appender-ref ref="consoleAppender"/>
    </root>
</configuration>
If you now start the application you should see that the outputs are in JSON-Format:
{"@timestamp":"2018-06-12T14:54:34.586+02:00","@version":"1","message":"Starting ProtocolHandler [\"http-nio-8080\"]","logger_name":"org.apache.coyote.http11.Http11NioProtocol","thread_name":"main","level":"INFO","level_value":20000}
{"@timestamp":"2018-06-12T14:54:34.587+02:00","@version":"1","message":"Using a shared selector for servlet write/read","logger_name":"org.apache.tomcat.util.net.NioSelectorPool","thread_name":"main","level":"INFO","level_value":20000}
{"@timestamp":"2018-06-12T14:54:34.592+02:00","@version":"1","message":"Tomcat started on port(s): 8080 (http) with context path ''","logger_name":"org.springframework.boot.web.embedded.tomcat.TomcatWebServer","thread_name":"main","level":"INFO","level_value":20000}
{"@timestamp":"2018-06-12T14:54:34.598+02:00","@version":"1","message":"Started DemoApplication in 7.014 seconds (JVM running for 10.018)","logger_name":"de.koudingspawn.demo.DemoApplication","thread_name":"main","level":"INFO","level_value":20000}
Now everything is done in our application to make the logs readable by fluentd.
Setup fluentd
For how to setup fluentd please look at one of my last blog posts, there you can find a more detailed tutorial on how to setup monitoring with fluentd, kibana and elasticsearch.
Here is only a short version of fluentd setup:
---
apiVersion: v1
kind: ServiceAccount
metadata:
  name: fluentd
  namespace: logging

---
apiVersion: rbac.authorization.k8s.io/v1beta1
kind: ClusterRole
metadata:
  name: fluentd
  namespace: logging
rules:
- apiGroups:
  - ""
  resources:
  - pods
  - namespaces
  verbs:
  - get
  - list
  - watch

---
kind: ClusterRoleBinding
apiVersion: rbac.authorization.k8s.io/v1beta1
metadata:
  name: fluentd
roleRef:
  kind: ClusterRole
  name: fluentd
  apiGroup: rbac.authorization.k8s.io
subjects:
- kind: ServiceAccount
  name: fluentd
  namespace: logging

---
apiVersion: extensions/v1beta1
kind: DaemonSet
metadata:
  name: fluentd
  namespace: logging
  labels:
    k8s-app: fluentd-logging
    version: v1
    kubernetes.io/cluster-service: "true"
spec:
  template:
    metadata:
      labels:
        k8s-app: fluentd-logging
        version: v1
        kubernetes.io/cluster-service: "true"
    spec:
      serviceAccount: fluentd
      serviceAccountName: fluentd
      tolerations:
      - key: node-role.kubernetes.io/master
        effect: NoSchedule
      containers:
      - name: fluentd
        image: fluent/fluentd-kubernetes-daemonset:elasticsearch
        env:
          - name:  FLUENT_ELASTICSEARCH_HOST
            value: "elasticsearch"
          - name:  FLUENT_ELASTICSEARCH_PORT
            value: "9200"
          - name: FLUENT_ELASTICSEARCH_SCHEME
            value: "http"
        resources:
          limits:
            memory: 200Mi
          requests:
            cpu: 100m
            memory: 200Mi
        volumeMounts:
        - name: varlog
          mountPath: /var/log
        - name: varlibdockercontainers
          mountPath: /var/lib/docker/containers
          readOnly: true
      terminationGracePeriodSeconds: 30
      volumes:
      - name: varlog
        hostPath:
          path: /var/log
      - name: varlibdockercontainers
        hostPath:
          path: /var/lib/docker/containers
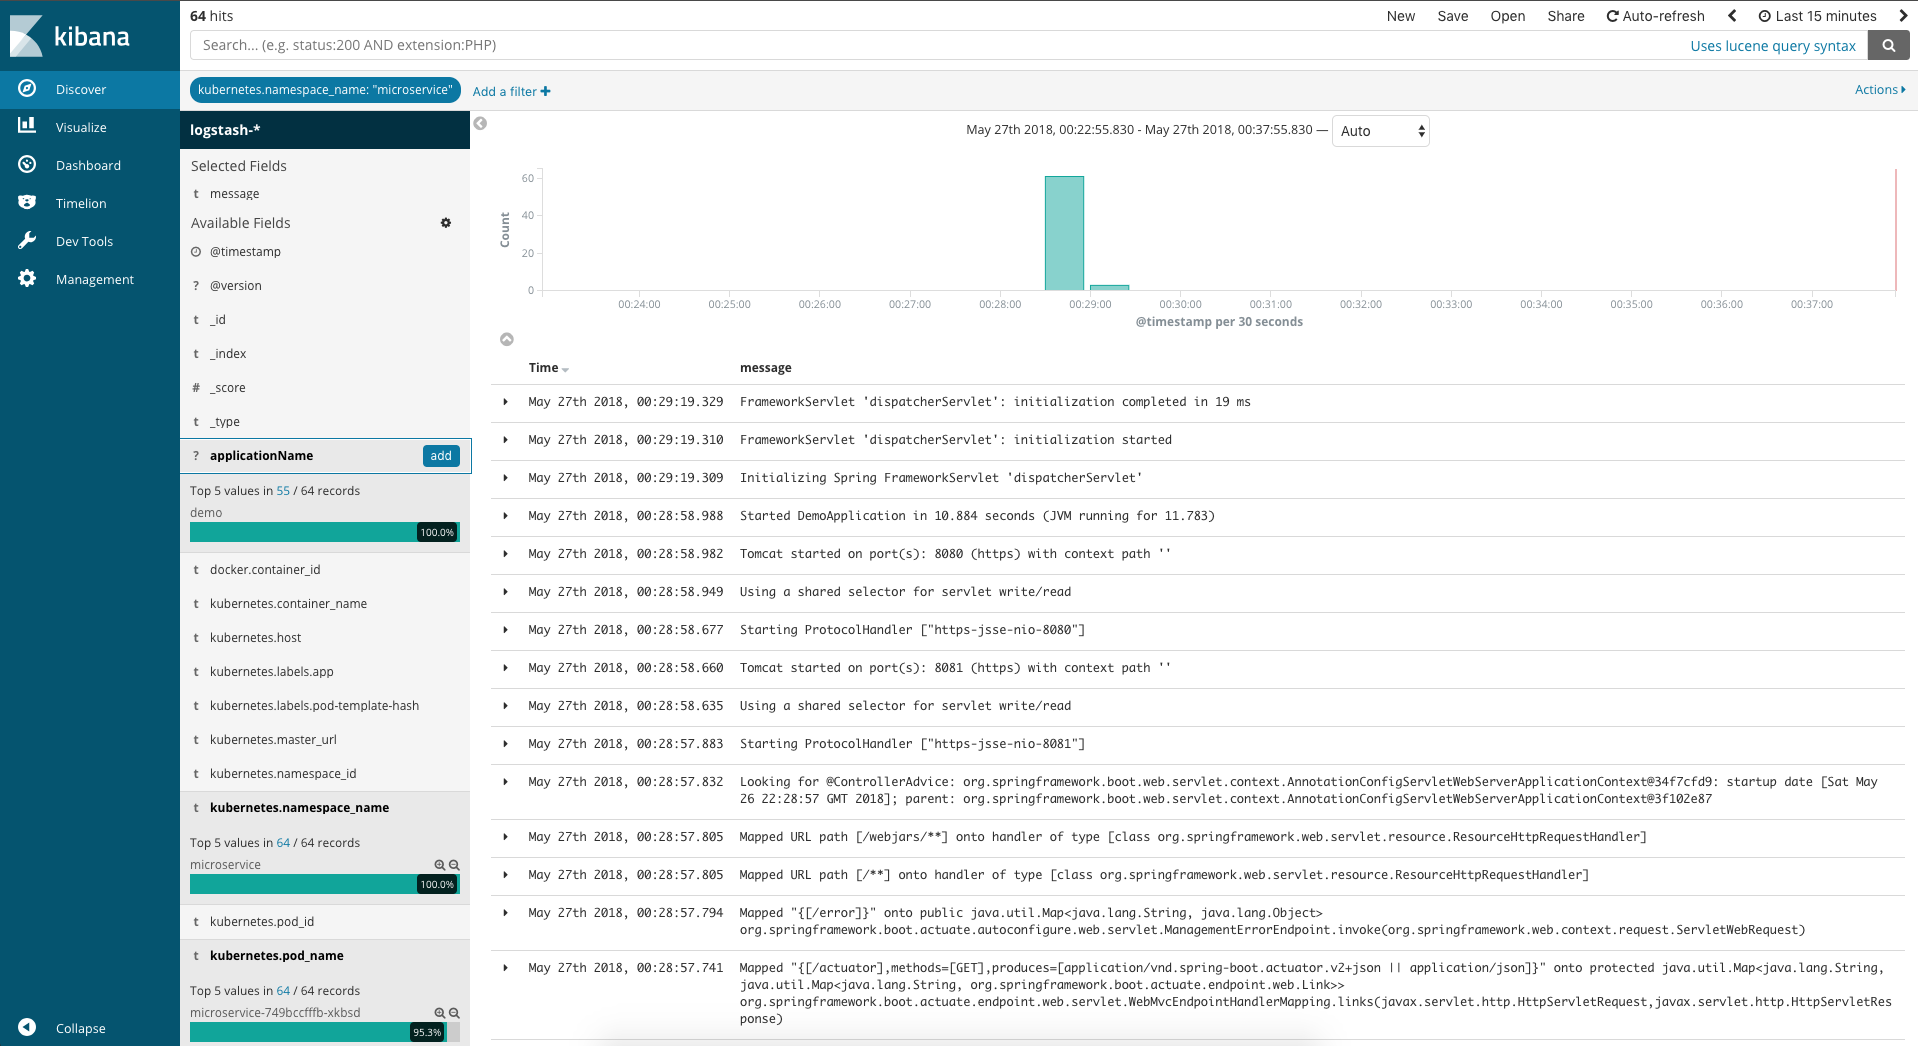
After you have redeployed the application with the changes for logging, you should see in Kibana the application logs: