Extended Prometheus AWS Discovery
During some development in the last month I detected, that the Prometheus based discovery of EC2 instances is very limited in the functionalities. When it comes to more then one exporter that runs on an instance it can become very tricky.
How ec2_sd_configs work
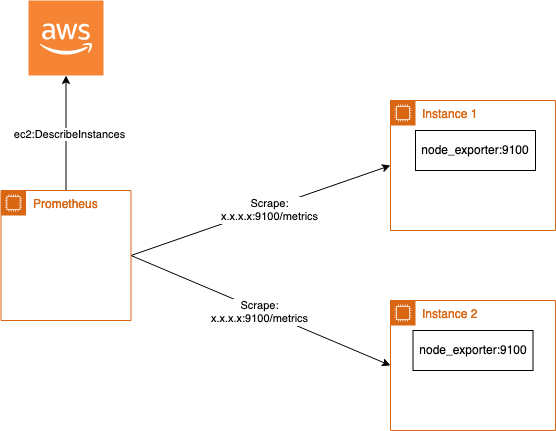
A small example: A base AMI contains a node_exporter that runs by default on each EC2 instance and Prometheus can scrape on port 9100 the metrics exposed by the exporter. The config for this is very simple:
global:
...

scrape_configs:
...
- job_name: ec2_exporter
  relabel_configs:
    - source_labels: [__meta_ec2_tag_Name]
      target_label: instance
    - source_labels: [__meta_ec2_private_ip]
      target_label: ip
  ec2_sd_configs:
    - region: eu-central-1
      port: 9100
...
Now you only have to configure your EC2 instance with an Instance Profile to allow ec2:DescribeInstances and all instances are scraped on port 9100 and path /metrics for node_exporter metrics. This is very easy and usefull as it already gives you with few lines of scrape configuration all metrics from instances.
How to monitor multiple exporter
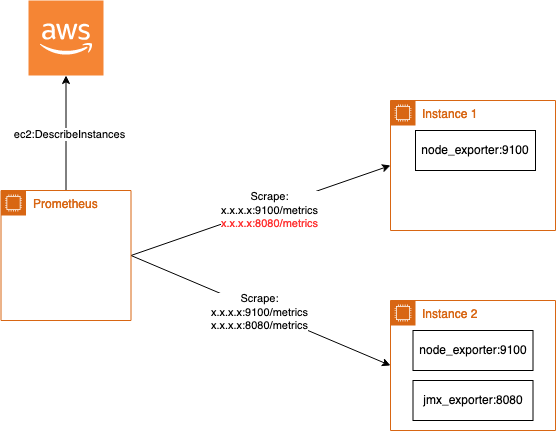
But what happens in case you have a specific exporter only on some instances like a jmx_exporter to expose kafka metrics running on port 8080. The easiest solution could be to append a new port like this:
global:
...

scrape_configs:
...
- job_name: ec2_exporter
  relabel_configs:
    - source_labels: [__meta_ec2_tag_Name]
      target_label: instance
    - source_labels: [__meta_ec2_private_ip]
      target_label: ip
  ec2_sd_configs:
    - region: eu-central-1
      port: 9100
    - region: eu-central-1
      port: 8080
The disadvantage of this solution, each instance now gets scraped for metrics on port 8080. This produces traffic that is not required and can in some cases also generate security alerts.
Merge metrics
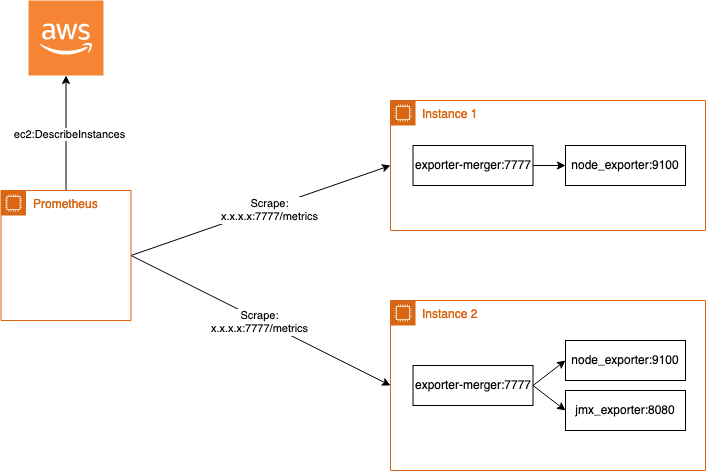
One solution could be to merge all metrics running on one instance into one exporter called exporter-merger developed by rebuy-de. So multiple exporters like the node_exporter and the jmx_exporter are configured as exporter endpoints on the local machine and in case of scraping the metrics by Prometheus, exporter-merger scrapes the configured endpoints and returns the metrics to Prometheus in a merged way.
This is simmilar to the first approach only the port should be changed:
global:
...

scrape_configs:
...
- job_name: ec2_exporter
  relabel_configs:
    - source_labels: [__meta_ec2_tag_Name]
      target_label: instance
    - source_labels: [__meta_ec2_private_ip]
      target_label: ip
  ec2_sd_configs:
    - region: eu-central-1
      port: 9100
The Github page also describes how to use it on Kubernetes to merge multiple metrics in a pod, as the kubernetes_sd_config itself again only supports one annotation.
Discovery based EC2 Tags
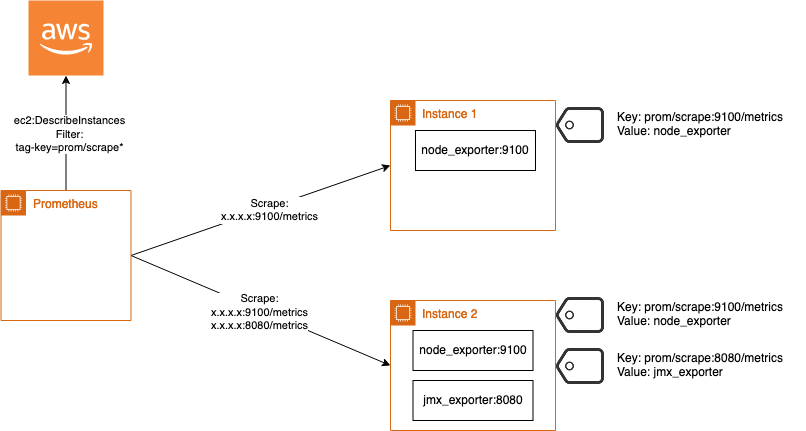
Another solution could be to discover exporter based on EC2 Tags. This allows to dynamically reconfigure Prometheus in case a new instance gets detected. Here the github repo: prometheus-aws-discovery
Run on instance
Therefore a simple go binary must be executed next to Prometheus that scrapes and generates a file that is readable by file_sd_config. By default Prometheus now checks this file every 5 minutes to detect if there is a change available.
curl -L -o prometheus-aws-discovery https://github.com/DaspawnW/prometheus-aws-discovery/releases/download/v0.3/prometheus-aws-discovery-linux-amd64
The file_sd_config should look like this:
global:
...

scrape_configs:
...
- job_name: aws-discovery
  file_sd_config:
    - files:
      - /etc/prometheus-aws-discovery/prometheus-aws-discovery.json
And a cronjob that regenerates the prometheus-aws-discovery.json file for example every 5 minutes:
*/5 * * * * /etc/prometheus-aws-discovery/prometheus-aws-discovery -output file -file-path /etc/prometheus-aws-discovery/prometheus-aws-discovery.json
Run in Kubernetes
In case you are using the Prometheus helm chart you can also use it with Kubernetes. Therefore the following CronJob can update the server-configmap.yaml and add a new key to it in the json format readable by file_sd_config:
apiVersion: batch/v1beta1
kind: CronJob
metadata:
  name: aws-prometheus-discovery-job
spec:
  concurrencyPolicy: Replace
  failedJobsHistoryLimit: 1
  successfulJobsHistoryLimit: 0
  schedule: "{{ .Values.awsdiscovery.schedule }}"
  jobTemplate:
    spec:
      backoffLimit: 2
      template:
        metadata:
          {{- if .Values.awsdiscovery.podAnnotations }}
          annotations:
{{ toYaml .Values.awsdiscovery.podAnnotations | indent 12 }}
          {{- end }}
        spec:
          restartPolicy: OnFailure
          serviceAccountName: aws-prometheus-discovery-job
          containers:
            - name: aws-discovery
              image: "{{ .Values.awsdiscovery.image }}:{{ .Values.awsdiscovery.tag }}"
              args:
                - -output=kubernetes
                - -kube-configmap-name={{ .Values.awsdiscovery.configmapName }}
                - -kube-configmap-key=prometheus-aws-discovery.json
              env:
                - name: "AWS_REGION"
                  value: "eu-central-1"
The following RBAC configuration is required:
apiVersion: rbac.authorization.k8s.io/v1beta1
kind: Role
metadata:
  name: aws-prometheus-discovery-job
rules:
  - apiGroups:
      - ""
    resources:
      - configmaps
    resourceNames:
      - {{ .Values.awsdiscovery.configmapName }}
    verbs:
      - get
      - update
      - patch
---
apiVersion: v1
kind: ServiceAccount
metadata:
  name: aws-prometheus-discovery-job
---
apiVersion: rbac.authorization.k8s.io/v1beta1
kind: RoleBinding
metadata:
  name: aws-prometheus-discovery-job
subjects:
  - kind: ServiceAccount
    namespace: {{ .Release.Namespace }}
    name: aws-prometheus-discovery-job
roleRef:
  kind: Role
  name: aws-prometheus-discovery-job
  apiGroup: rbac.authorization.k8s.io
The following values are required:
awsdiscovery:
  schedule: "*/5 * * * *"

  ### in case you are using kube2iam here you can configure the role
  #podAnnotations:

  image: daspawnw/prometheus-aws-discovery
  tag: v0.3

  configmapName: prometheus
Afterwards the prometheus.yaml file must be extended to read the file_sd_config as described in the example above.
Now Prometheus detects new instances based on tags and reconfigures itself when a new instance starts or terminates.