Monitoring of Kubernetes with Prometheus
Monitoring of a Kubernetes Cluster is very important. There are many information in the cluster that can be used to answer questions like: How is the current memory, storage or cpu usage? Which container uses how many of the resources? But also questions about the status of applications running in the cluster.
One tool that has established itself is Prometheus. It is in the Cloud Native Computing Foundation and was originally built at SoundCloud. The idea behind Prometheus is very easy:
Architecture
A Prometheus server runs e.g. in a kubernetes cluster and gets a configuration via file. This configuration consists of information where for example an endpoint lives to scrape in a defined interval. Then the Prometheus server asks this endpoints for metrics in a special format (typically exposed via /metrics) and saves them in a timeseries database. Here you can find a short example of a small configuration file that asks a node_exporter module that is deployed as agent on each node for metrics:
scrape_configs:
  - job_name: "node_exporter"
    scrape_interval: "15s"
    target_groups:
    - targets: ['<ip>:9100']
First you define a job_name, this job name can be used later for querying metrics in Prometheus, then you define a scrape_interval and a group of servers where the node_exporter runs on. From now on Prometheus asks the server every 15 seconds on path /metrics for current metrics. This looks like this:
# HELP go_gc_duration_seconds A summary of the GC invocation durations.
# TYPE go_gc_duration_seconds summary
go_gc_duration_seconds{quantile="0"} 1.4852e-05
go_gc_duration_seconds{quantile="0.25"} 2.0702e-05
go_gc_duration_seconds{quantile="0.5"} 2.2059e-05
...
First you can see the name of the metric, then labels (the part in the brackets) and the last part is then the value of the metric. The interresting part is the functionality to search through these metrics. Prometheus has therefore a very powerful query language.
The main idea as already described is, that Prometheus asks a port in a specified interval for metrics and stores them in the timeseries database. If it is not possible for Prometheus to scrape the metrics there is another functionality called pushgateway. This pushgateway allows external jobs to send their metrics to the pushgateway and Prometheus scrapes the push gateway in the specified interval for metrics.
Another optional component in the Prometheus architecture is the alertmanager. The alertmanager allows to define limits and if the limits are exceeded notifications can be send via mail, slack or opsgenie for example.
The Prometheus server additionally arrives with many integrated features like asking the Amazon API for ec2 instances or asking kubernetes for pods, nodes and services. There are also a lot of exporters like the node_exporter, which I mentioned earlier. These exporters run for example on a node where a application like MySQL is installed and ask the application in an interval for metrics and exposes them via a /metrics endpoint, so the Prometheus server can scrape these metrics.
It is also very easy to write your own exporter for example for an application that exposes metrics like jvm information. There is for example a library developed by Prometheus to export such metrics. These library can be used in combination with spring and allows to define also your own metrics. A cool example from the client_java page looks for example:
@Controller
public class MyController {
  @RequestMapping("/")
  @PrometheusTimeMethod(name = "my_controller_path_duration_seconds", help = "Some helpful info here")
  public Object handleMain() {
    // Do something
  }
}
This metric that describes the duration for the method and other metrics can now be exposed via an endpoint or can be pushed to the pushgateway.
Usage in a Kubernetes cluster
To use Prometheus in a kubernetes cluster there are as already descibed some integrated features to scrape pod, node and service information. The interresting part is, that kubernetes is designed for usage with Prometheus. For example the kubelet and the kube-apiserver expose metrics that are readable for Prometheus and so it is very easy to do monitoring.
In this example I’ll use the official helm chart to get started. The installation and usage of helm I’ll describe in a later post (on the TODO).
For me I made some changes to the default installation of the helm chart. The first one is, I need to enable rbac for the Prometheus installation, otherwise Prometheus is not able to scrape information from the kube-apiserver. Therefore I wrote my own values.yaml file, this file contains the information how the helm chart should be rendered.
The changes I made are very easy:
alertmanager.enabled: falsefor me I disabled the alertmanager to be deployed to the cluster (I won’t use the alertmanager, I think the configuration of alerts can be made easier with Grafana)kubeStateMetrics.enabled: falsethese metrics I think only return few metrics about the limit of pods. This is for my first run not importantserver.persistentVolume.enabled: falseI have currently no default persistent Volume configured (One of my next TODO’s)- I changed the scrape configuration of Prometheus, as done in the pull request on github. The reason is in Kubernetes v1.7 the cAdvisor metrics run on a different port.
After this we can start Prometheus via helm:
helm install stable/prometheus --name prometheus-monitoring -f prometheus-values.yaml
This will install the Prometheus server and on each node a node_exporter pod. Now we are able to visit the web ui of Prometheus to see some information:
kubectl port-forward <prometheus-server-pod> 9090
In the following screenshot we can see which targets Prometheus scrapes (Status/targets) and when the last scrapes were made:
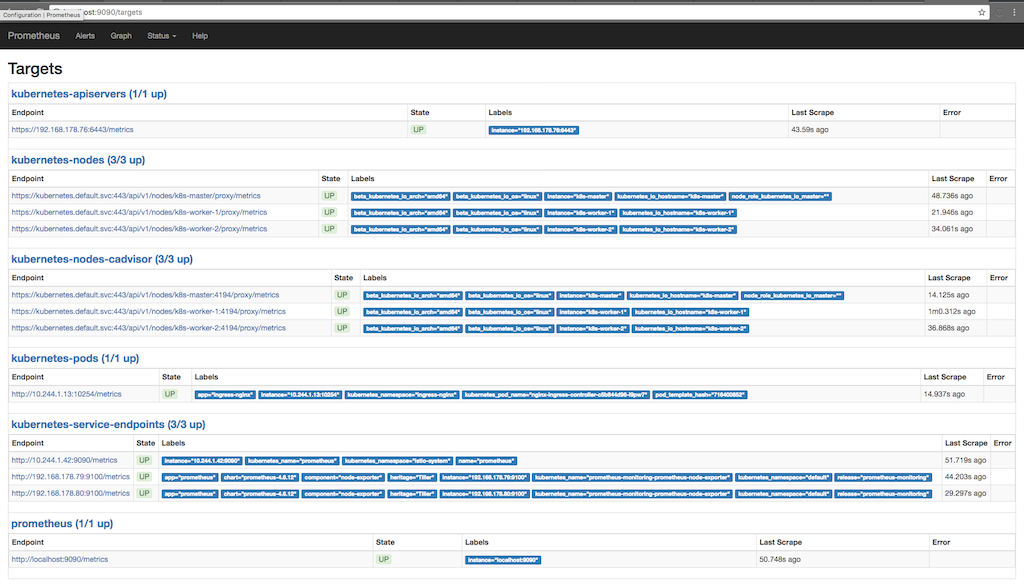
There we can see, that Prometheus asks the apiserver, the nodes, the cadvisor running on the nodes and the kubernetes service endpoints for metrics. We can see metrics in detail if we go to Graph and write a query to see some information:
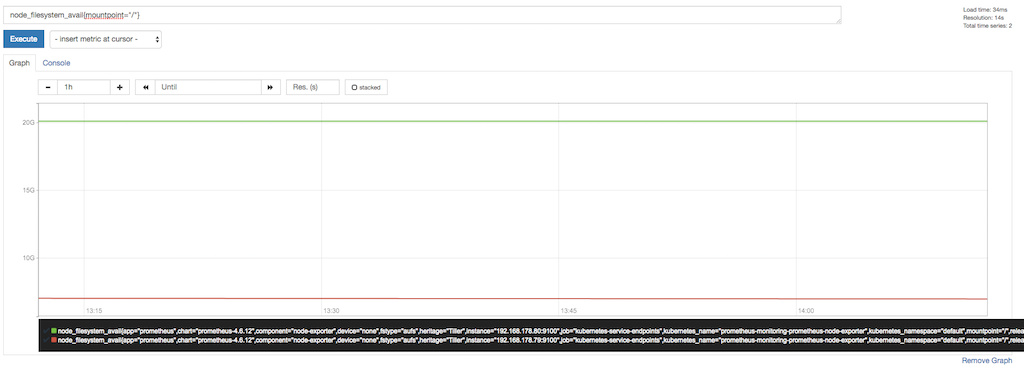
Here we can see for example the free storage at mountpoint “/”. At the bottom of the graph we can see the labels appended by Prometheus or already available by the node_exporter. We use these labels to query for only the mountpoint “/”.
Custom metrics with annotations
As you already saw in the first image that shows the targets that Prometheus asks for metrics there is also a metric for a pod running in the cluster. One nice feature Prometheus has is the functionality to scrape also pods. If a container in a pod exposes Prometheus metrics we can scrape these metrics automatically by Prometheus. The only think we need to do is to annotate the deployment with two annotations, in my case the nginx-ingress-controller does this for us out of the box:
apiVersion: extensions/v1beta1
kind: Deployment
metadata:
  name: nginx-ingress-controller
  namespace: ingress-nginx
spec:
  replicas: 1
  selector:
    matchLabels:
      app: ingress-nginx
  template:
    metadata:
      labels:
        app: ingress-nginx
      annotations:
        prometheus.io/port: '10254'
        prometheus.io/scrape: 'true'
...
Here we can see that the deployment template is annotated with two Prometheus annotations, the first describes the port which Prometheus should use to ask for metrics and the second enables the scrape functionality. Prometheus now asks the Kubernetes Api-Server for Pods that are annotated with the scrape annotation and tries to scrape the /metrics endpoint for information.
Usage in federated mode
In a project we use Prometheus in federated mode. The idea is we only scrape the information that are only available from inside the cluster (or it is easier to get these information from inside the cluster) and scrape these information via federation from a second Prometheus installed outside the cluster. This allows us to scrape more then one kubernetes cluster and also to scrape other components that are not accessible from inside the cluster or which do not concern the cluster. In addition, it is then not necessary to save the scraped data persistent inside of the cluster and if in the cluster something happens wrong we are able to scrape some information like the node_exporter from outside the cluster to get more information.