Horizontal Pod Autoscaling by memory
With Kubernetes 1.8 the new HorizontalPodAutoscaler (HPA) was introduced that allows other metrics to be defined then only CPU and custom metrics. Now it is possible to define also metrics like Requestcount in Ingress and Memory utilization. In this post I’ll show how to setup a HorizontalPodAutoscaler that scales up/down if the memory utilization increases or decreases a percentage limit.
Requirements
The only requirement for HPA is Heapster. Heapster is used by the HPA to receive metric information like cpu and memory usage and to descide with this information to scale up, down or hold. The installation of heapster is simple and can be performed as described on the GitHub Page. For me I used the InfluxDB version with Grafana to also see what happens inside of the cluster. For the HPA to work successfully I had to adjust the following parameters in the heapster.yaml:
- I switched the “–source” command argument from https://kubernetes.default to https://10.32.0.1
- I added a command argument called “–metric-resolution=30s”. For my first tests the HPA fails because the metrics could not be loaded. In a GitHub Issue I found this information and it seems to work better.
Setup a HorizontalPodAutoscaler
A horizontal pod autoscaler is defined as yaml file. The definition is very easy to understand:
apiVersion: autoscaling/v2beta1
kind: HorizontalPodAutoscaler
metadata:
  name: resize-hpa
  namespace: resize
spec:
  scaleTargetRef:
    apiVersion: apps/v1beta1
    kind: Deployment
    name: image-resizer
  minReplicas: 2
  maxReplicas: 10
  metrics:
  - type: Resource
    resource:
      name: memory
      targetAverageUtilization: 60
In the first part I describe that the HorizontalPodAutoscaler has to run inside of the resize namespace (more about it later…). The important part is the information for the resource to be scaled. In this case we say a Deployment called image-resizer should be scaled by this scaler. Then we define the minReplicas and maxReplicas values. This defines how many pods of the deployment should exist. In this case we say a minimum number of 2 pods should exist and the scaler can scale the pods count to max 10 pods. In this range the HorizontalPodAutoscaler can scale as he likes. The last part is the information about the resource the HPA should monitor to make decisions about the count of pods. Here we say that the average utilization of memory should not overrun an average of 60%. This is all to define a Horizontal Pod Autoscaler. With kubectl apply -f <filename> we can apply the HPA to the cluster.
Image resizer
The application
To test the HPA a bit I wrote an application that receives calls to resize an image to 20% of it’s initial size. Therefore I wrote an endpoint that receives HTTP requests in multipart/form-data format with an image and resizes it to 20% and then returns the image as HTTP response. The application was written in Spring Boot:
@RestController
@RequestMapping("/api")
public class ImageResizerController {

    private final ImageResizerService imageResizerService;

    public ImageResizerController(ImageResizerService imageResizerService) {
        this.imageResizerService = imageResizerService;
    }

    @PostMapping("/resize")
    public ResponseEntity<?> resize(
            @RequestParam("data")MultipartFile file) {

        try {
            BufferedImage resizedImage = this.imageResizerService.resize(file.getBytes());

            ByteArrayOutputStream byteArrayOutputStream = new ByteArrayOutputStream();
            ImageIO.write( resizedImage  , "jpg", byteArrayOutputStream);
            byte[] bytes = byteArrayOutputStream.toByteArray();

            return ResponseEntity.ok()
                    .contentLength(bytes.length)
                    .contentType(MediaType.APPLICATION_OCTET_STREAM)
                    .body(bytes);
        } catch (IOException e) {
            return new ResponseEntity<>(HttpStatus.INTERNAL_SERVER_ERROR);
        }

    }

}
@Component
public class ImageResizerService {

    public BufferedImage resize(byte[] image) throws IOException {
        InputStream in = new ByteArrayInputStream(image);
        BufferedImage imageBuf = ImageIO.read(in);

        int targetHeight = (int) (imageBuf.getHeight() * 0.2);
        int targetWidth = (int) (imageBuf.getWidth() * 0.2);

        BufferedImage resizedImage = new BufferedImage(targetWidth, targetHeight, imageBuf.getType());
        Graphics2D g = resizedImage.createGraphics();
        g.drawImage(imageBuf, 0, 0, targetWidth, targetHeight, null);
        g.dispose();

        return resizedImage;
    }

}
Additionally I added the actuator framework to get health checks to reschedule a server if it hangs. The deployment of the server is very easy with an ingress, deployment and service. To let the HPA descide if the average memory utilization is more than the 60% we need to specify a memory limit, here I used 538Mi. I also specified -Xmx and -Xms parameters for the JVM. The values are 5% smaller then the resource limits I specified for the containers in the deployment pod template (512m). Here is the deployment:
apiVersion: apps/v1beta2
kind: Deployment
metadata:
  name: image-resizer
  namespace: resize
  labels:
    app: image-resizer
spec:
  replicas: 2
  selector:
    matchLabels:
      app: image-resizer
  template:
    metadata:
      labels:
        app: image-resizer
    spec:
      containers:
      - name: image-resizer
        image: <docker-image>:latest
        resources:
          limits:
            memory: "538Mi"
        env:
        - name: JAVA_OPTS
          value: "-Xmx512m -Xms512m"
        ports:
        - containerPort: 8080
        livenessProbe:
          httpGet:
            path: /health
            port: 8080
          initialDelaySeconds: 30
          timeoutSeconds: 5
          failureThreshold: 3
        readinessProbe:
          httpGet:
            path: /health
            port: 8080
          initialDelaySeconds: 25
          timeoutSeconds: 5
          failureThreshold: 5
      imagePullSecrets:
      - name: gitlab-com
I also defined an ingress, here it is important to add the “ingress.kubernetes.io/proxy-body-size” annotation because otherwise the max file size limit is 1MB. The same I also added to the Spring Boot application.properties file to allow bigger files.
apiVersion: extensions/v1beta1
kind: Ingress
metadata:
  name: ingress-image-resizer
  namespace: resize
  annotations:
    kubernetes.io/ingress.class: "nginx"
    ingress.kubernetes.io/proxy-body-size: 8m
spec:
  rules:
  - host: <domain>
    http:
      paths:
      - path: /
        backend:
          serviceName: image-resizer
          servicePort: 8080
The infrastructur
To run the test I started a 4 Node Kubernetes Cluster with 2GB RAM for each node, 1 Master and 1 ETCD node. In front of the 4 nodes I deployed a DigitalOcean Load Balancer. The Load Tests are executed from 2 other droplets. These droplets were small servers with a Docker installation on it to run the tests as Docker container.
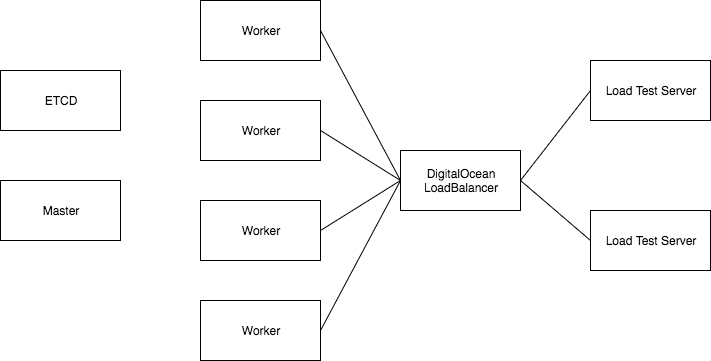
The test was written with Gatling and was configured to make from each Load Test node 250 Requests over 10 minutes in ramp mode (I think the ramp was not required). So with two nodes running the test we had a total of 500 Requests over 10 minutes to the Resize Server. The image has a size of 4.1MB.
class FileResizeSimulation extends Simulation {

  val httpConf = http
    .baseURL("http://resize.koudingspawn.de")
    .acceptHeader("text/html,application/xhtml+xml,application/xml;q=0.9,*/*;q=0.8")
    .doNotTrackHeader("1")
    .acceptLanguageHeader("en-US,en;q=0.5")
    .acceptEncodingHeader("gzip, deflate")
    .userAgentHeader("Mozilla/5.0 (Macintosh; Intel Mac OS X 10.8; rv:16.0) Gecko/20100101 Firefox/16.0")

  val scn = scenario("Upload file to be resized")
    .exec(http("request_1")
      .post("/api/resize")
      .formUpload("data", "testimage.jpg"))

  setUp(scn.inject(rampUsers(250) over (10 minutes)).protocols(httpConf))
}
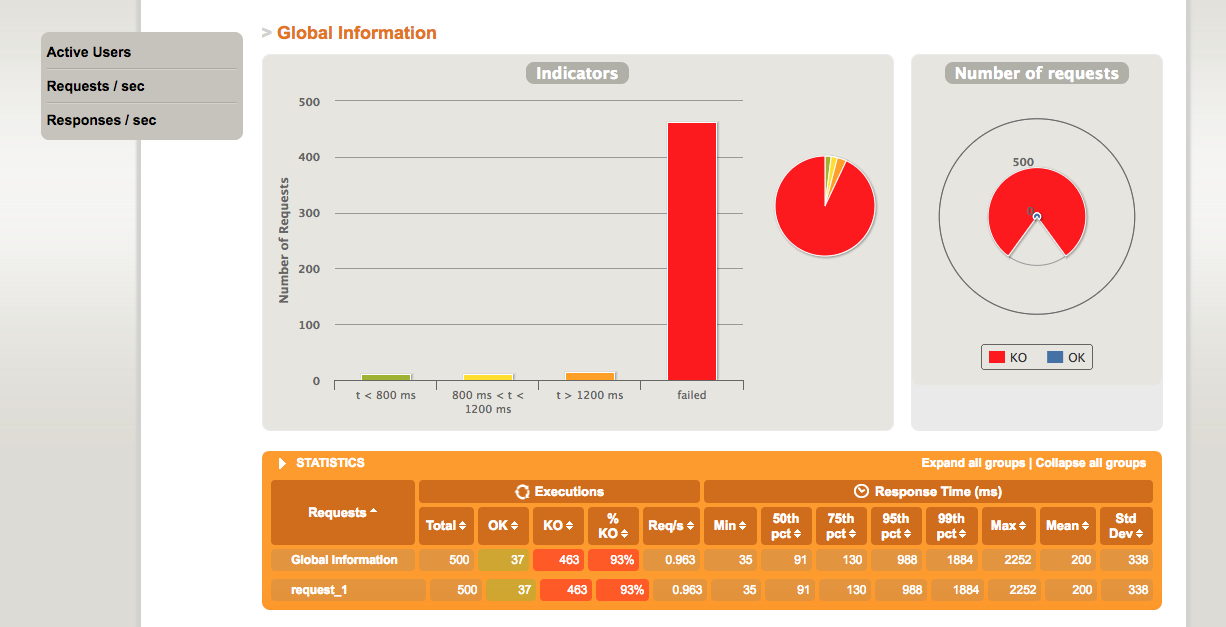
What happen if we use no HorizontalPodAutoscaler
First try was to run the deployment with 2 Replicas without the HorizontalPodAutoscaler. The result says that 93% of the requests failed and only 37 of the 500 Requests succeeded. The reason for this was that the Pods run out of service by the livenessProbes and when they came back they are killed again instantly.
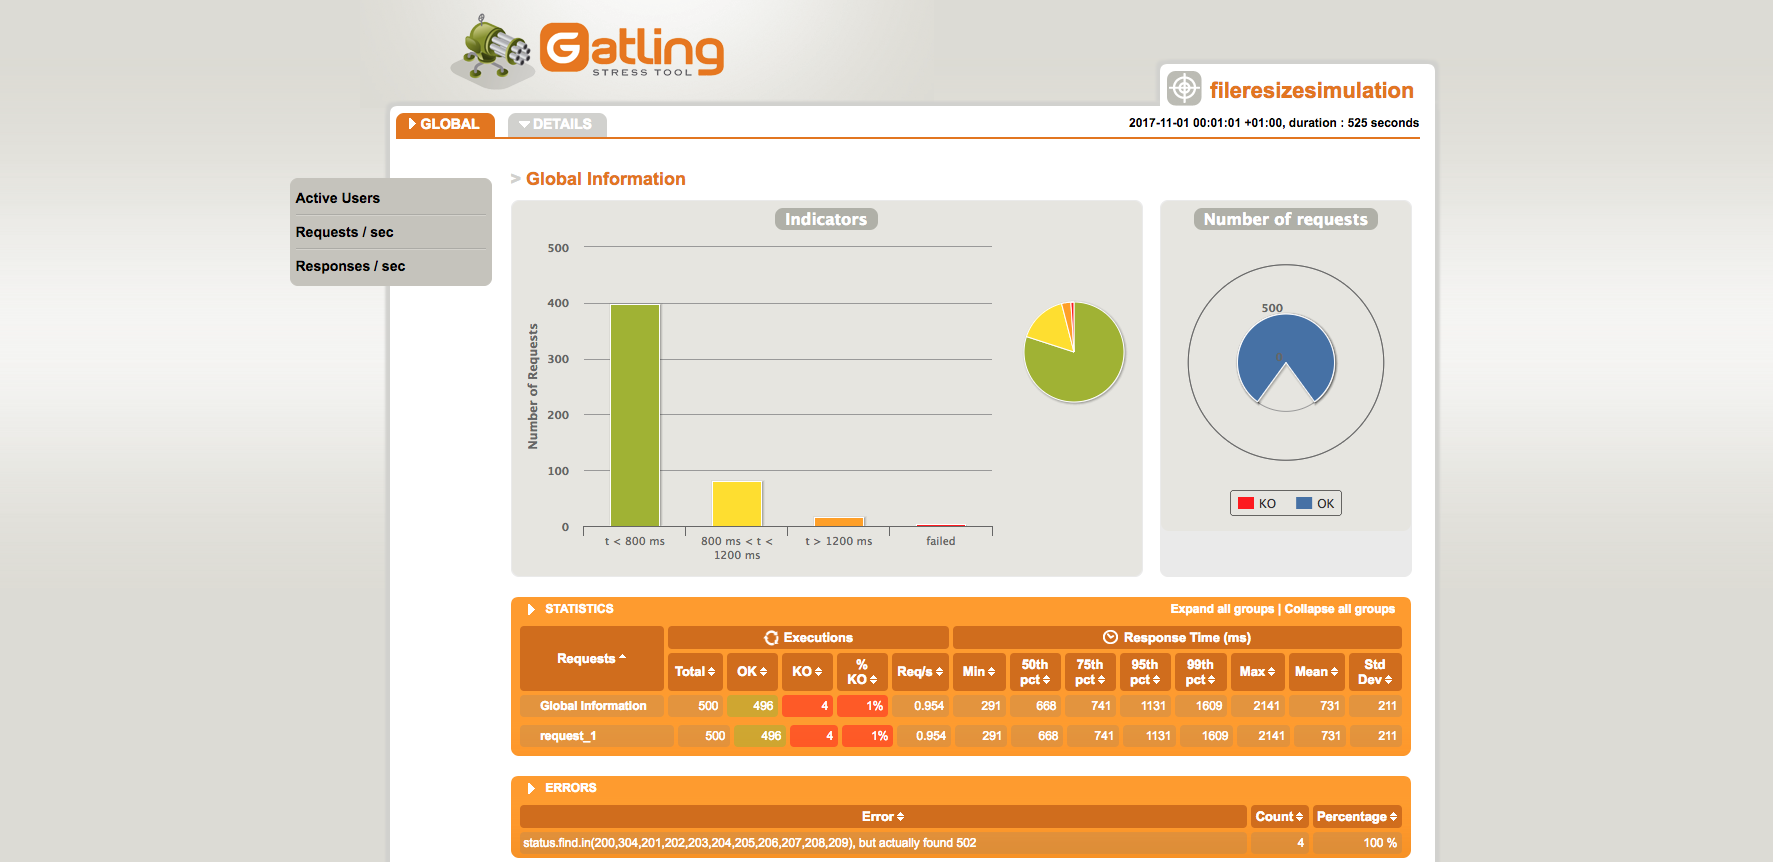
What happend with HorizontalPodAutoscaler
After this I enabled the HPA and run the test again. This time only 4 requests failed and all other 496 tests were successful. The only bad thing were the count of requests that took more than 800ms.
The problem were that the period between the start of new pods were 3 minutes so in the time of the test only 2 new pods came up. The HPA therefore considers a parameter called horizontal-pod-autoscaler-upscale-delay that defines how long to wait before scale up a new pod. To change this we need to reconfigure our kube-controller-manager.service. There I defined that the period between new pods should be 1 minute:
/usr/bin/kube-controller-manager \
    --allocate-node-cidrs=false \
    --cloud-provider= \
    --cluster-cidr=10.200.0.0/16 \
    --cluster-signing-cert-file=/etc/kube-controller-manager/ca.pem \
    --cluster-signing-key-file=/etc/kube-controller-manager/ca-key.pem \
    --leader-elect=true \
    --master=http://localhost:8080 \
    --root-ca-file=/etc/kube-apiserver/kube-ca.pem \
    --service-account-private-key-file=/etc/kube-apiserver/kube-api-key.pem \
    --service-cluster-ip-range=10.32.0.0/24 \
    --horizontal-pod-autoscaler-upscale-delay=1m0s
You should also define a time that describes how long to wait before scale down a deployment if the average memory decreases.
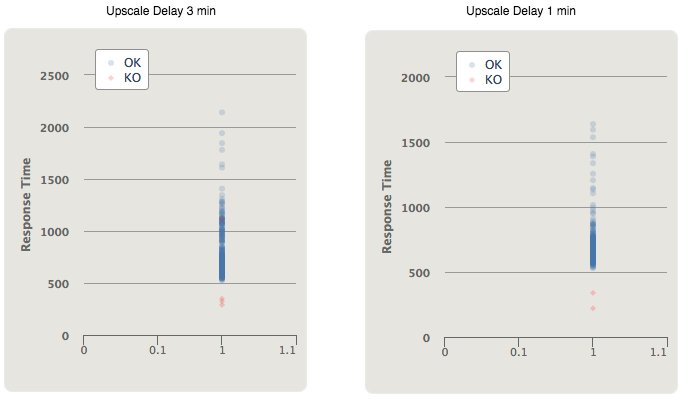
With this new parameter I run again the test. The results are very good only 2 requests failed and only 24 requests took longer then 800 ms:
Here you can see on the left side the response time before I changed the upscale delay from 3 minutes to 1 minute and on the right side the response time after I changed the upscale delay to 1 minute:
What happened in Kubernetes
I watched the HorizontalPodAutoscaler to see what happens inside of the cluster when the Load Test runs. Here are the outputs generated:
$ kubectl describe hpa -n resize resize-hpa

Name:                                                     resize-hpa
Namespace:                                                resize
Labels:                                                   <none>
Annotations:                                              kubectl.kubernetes.io/last-applied-configuration={"apiVersion":"autoscaling/v2beta1","kind":"HorizontalPodAutoscaler
","metadata":{"annotations":{},"name":"resize-hpa","namespace":"resize"},"spec":{"ma...
CreationTimestamp:                                        Wed, 01 Nov 2017 00:43:41 +0100
Reference:                                                Deployment/image-resizer
Metrics:                                                  ( current / target )
  resource memory on pods  (as a percentage of request):  70% (399076010666m) / 60%
Min replicas:                                             2
Max replicas:                                             10
Conditions:
  Type            Status  Reason              Message
  ----            ------  ------              -------
  AbleToScale     False   BackoffBoth         the time since the previous scale is still within both the downscale and upscale forbidden windows
  ScalingActive   True    ValidMetricFound    the HPA was able to succesfully calculate a replica count from memory resource utilization (percentage of request)
  ScalingLimited  False   DesiredWithinRange  the desired replica count is within the acceptible range
Events:
  Type    Reason             Age   From                       Message
  ----    ------             ----  ----                       -------
  Normal  SuccessfulRescale  2m    horizontal-pod-autoscaler  New size: 3; reason: memory resource utilization (percentage of request) above target
  Normal  SuccessfulRescale  1m    horizontal-pod-autoscaler  New size: 4; reason: memory resource utilization (percentage of request) above target
What we can see is first that currently there is an utilization of 70% percent of memory by the pods. Next we can see some Conditions that describe the current state of the HPA and what can be performed and what went wrong. Here we can see, that we created less than 3 minutes ago a new pod. So the HPA is not allowed to scale down currently (AbleToScale). Next we see, that HPA is able to calculate the metrics of memory utilization, therefore it accesses the heapster service and asks him for memory information about the pods. If the heapster connection fails the condition will fail. In my first tests this happend so I changed the metric-resolution to 30 seconds. That stabilized the HPA.
In the last section you can see what happend in the past with the HPA. Here you can see, that the HPA detected a memory utilization of more than 60% and added a new pod to the deployment.
Next you can see the running pods and that they start with a delay of 1 minute as specified in the kube-controller-manager service.
$ kubectl get pods
NAME                          READY     STATUS    RESTARTS   AGE
image-resizer-fdb6b7d-45hgs   1/1       Running   0          3m
image-resizer-fdb6b7d-7ltf9   1/1       Running   1          2m
image-resizer-fdb6b7d-94v2t   1/1       Running   1          11m
image-resizer-fdb6b7d-l8qs6   0/1       Running   0          25s
image-resizer-fdb6b7d-v8nzx   1/1       Running   0          11m