Java Performance Monitoring with Pinpoint
Monitoring of applications and their performance is not easy. There are many chargeable tools and also many free OpenSource tools. Today I found a solution to monitor Java Performance with a tool called Pinpoint. The usage is very easy, here I’ll describe how to setup the tool.
Install Pinpoint and its dependencies
The pinpoint application consists of three components:
A Pinpoint collector is used to receive via UDP and TCP the JVM information from the agents started with our Spring Boot application. The collector stores the data into an Apache HBase Storage and the Pinpoint Web UI is used to read the JVM information from the HBase Storage. Here is a docker-compose file to start the three components. After the application is started we can access the ui via localhost:3080 and see an empty list of applications.
Start the java agent
To start the Spring Boot application with the agent we first need to download the pinpoint agent package available via pinpoint release page. Then we set an environment variable to the directory of the pinpoint agent:
export AGENT_PATH=/Users/user/Downloads/pinpoint-agent-1.6.2
The pinpoint agent expects that there is a file called pinpoint.config. In this file we can specify the ip and ports of the collector service and additionally we can specify that we have a sampling rate of 1 (profiler.sampling.rate=1). This means that 100% of the requests will be transferred to the collector to be saved. Now we are able to start our application(s) with the javaagent:
java -javaagent:$AGENT_PATH/pinpoint-Bootstrap-1.6.2.jar -Dpinpoint.agentId=1 -Dpinpoint.applicationName=driver -jar driver.jar
The first parameter is the path to the pinpoint agent directory where the pinpoint-Bootstrap-*.jar is placed, the second parameter is a unique id for each agent (e.g. a UUID) and the last parameter is the name of the application. When we now start the application we first see some output of the pinpoint agent and after this we see the normal startup of the Spring Boot application.
Monitoring in the UI
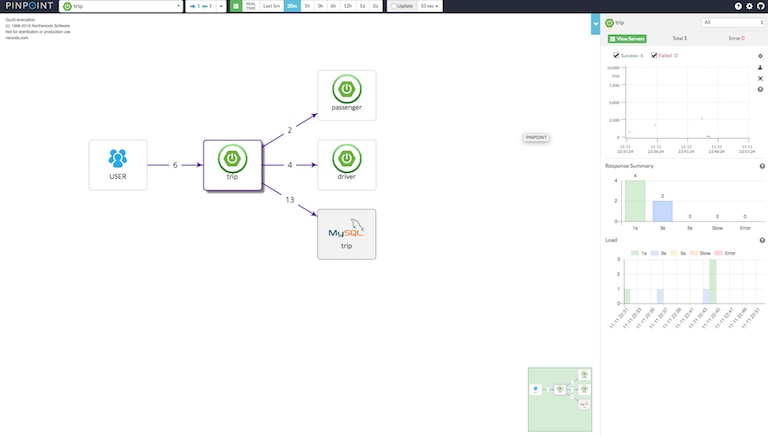
In the first picture you can see an overview of the trip application and the requests to external systems like two other Spring Boot microservices and a MySQL Database called trip. You can see also the count of requests and on the right side some information about the response time. In the right section you can now select from the scatter plot a range. This will open a second screen with a list of requests made to the trip ReST Api.
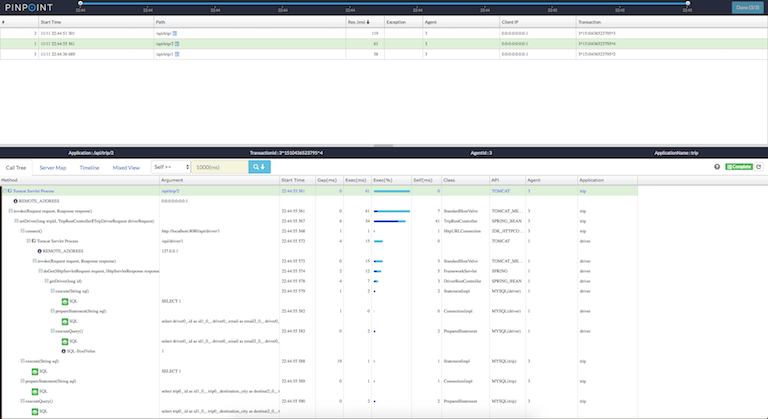
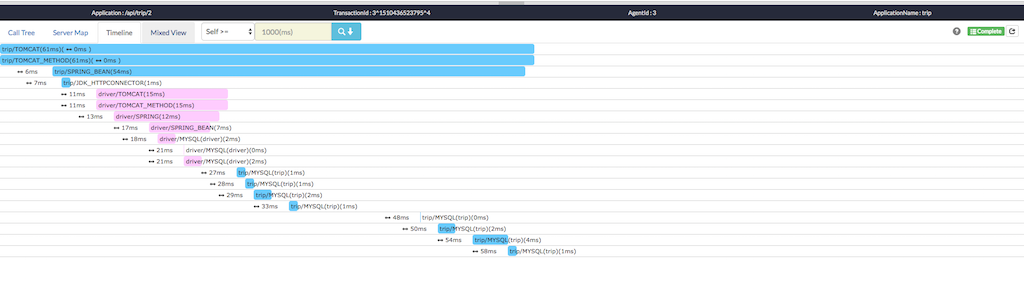
If you click on one of this requests you can see a trace route of the request from one application to another and also to the database. You can also see a list of SQL queries made in the trace. You can also click on Timeline to see it in a waterfall style.
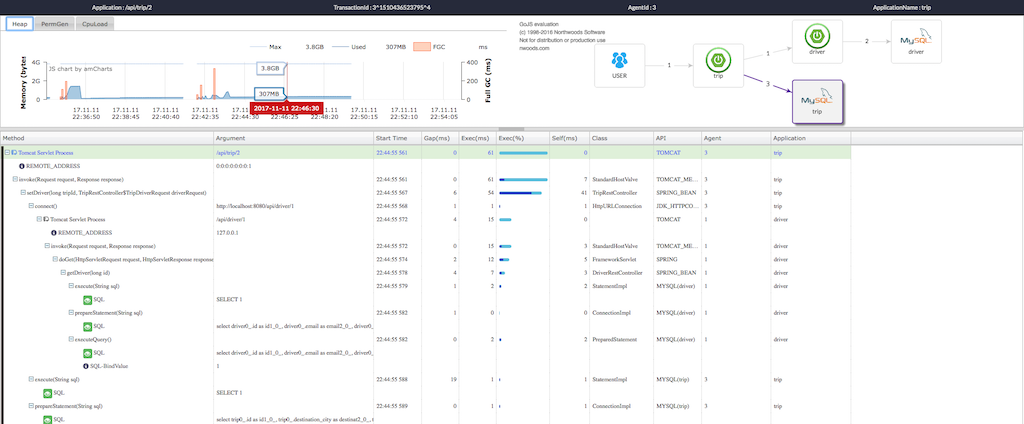
Additionally you can see the request in a view that shows the trace route a detailed map how the request flow through the microservices and how the memory and cpu usage was at this timestamp:
Conclusion
I think for an OpenSource Performence Monitoring tool Pinpoint is very cool. It is easy to use and the output is plausible. Pinpoint integrates with Databases like MySQL, Oracle and POSTGRESSQL. There is also support for RabbitMQ and Kafka planed.
Pinpoint itself describes the overhead for the agent with 3%, if this is correct or not I didn’t evaluated.